
Metrics
Lucity keeps track of how much CPU and memory each service uses, and how full each volume is.
Service metrics
Open a service on the canvas and switch to the Metrics tab. It charts CPU and memory over the last hour, 6 hours, 24 hours, 7 days or 30 days.
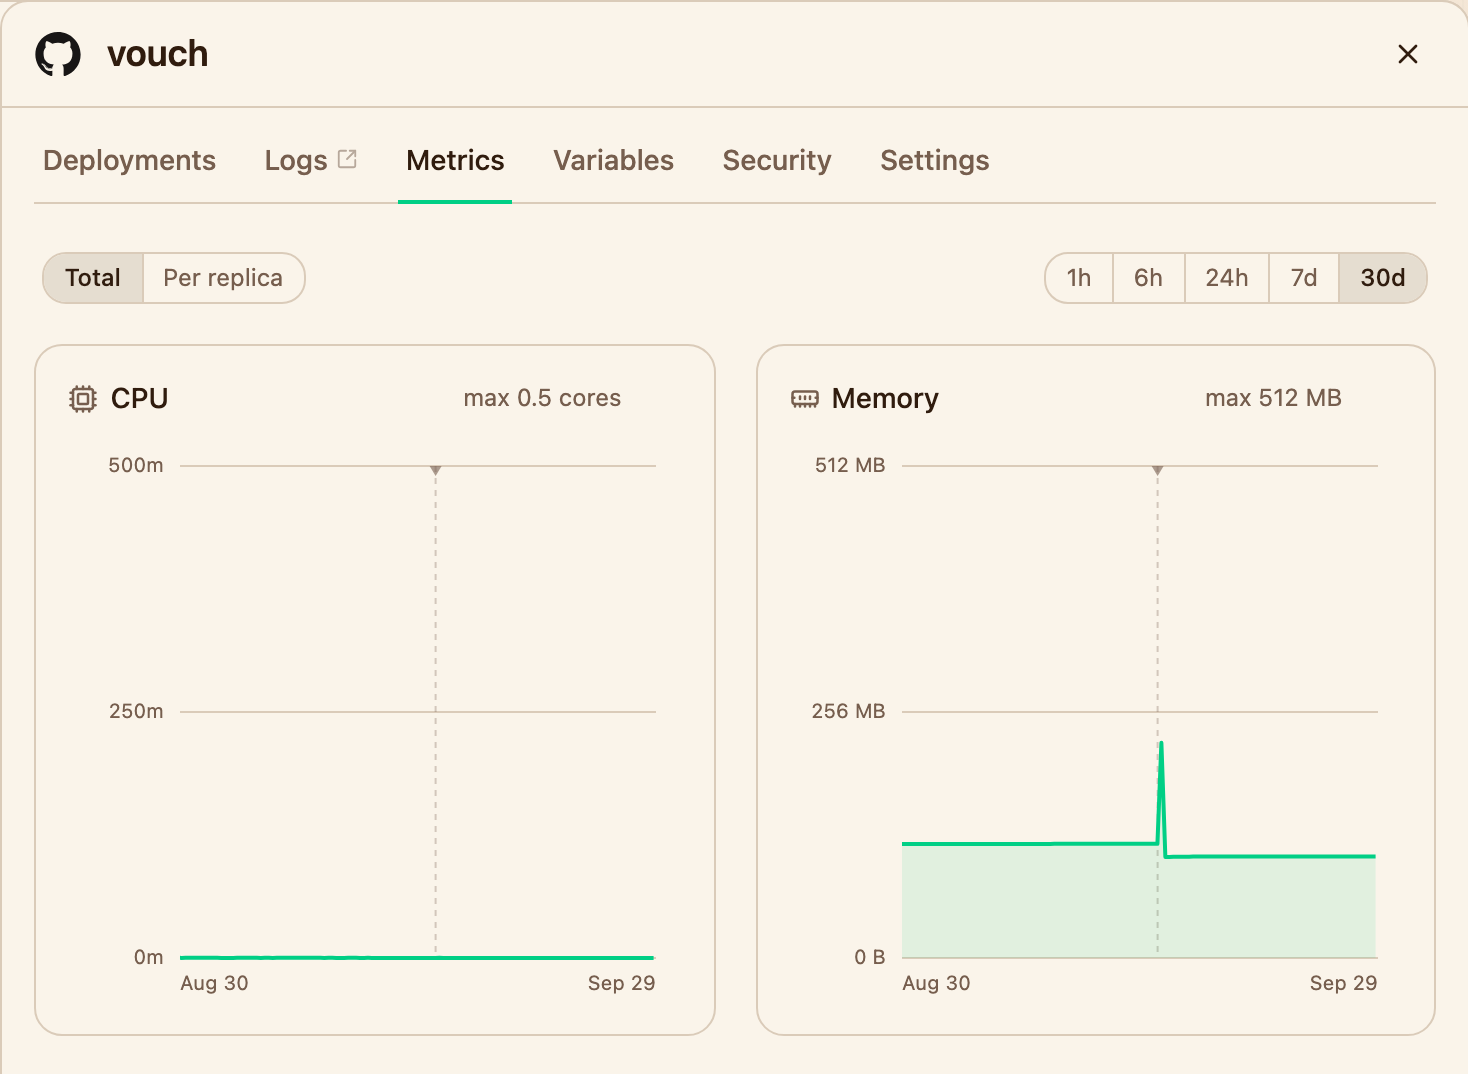
CPU and memory over 30 days. The dashed line marks a deployment.
Total adds up all replicas of the service, while Per replica splits the chart into one band per replica. The max next to each chart's title is the most the service can use, which is its CPU or memory limit times the number of replicas. Every deployment is marked with a dashed line, so you can tell whether a change moved the numbers. Hovering over a chart shows the exact values at that point in time, along with an Edit link to change the limit in the service settings, and CPU and memory explains what happens when a service reaches it.
CPU is measured in cores, and anything below one core is shown in thousandths, so 250m is a quarter of a core. Metrics show up a minute or two after a service starts, and the charts refresh every 30 seconds.
Volume usage
Open a volume and switch to the Usage tab to see how much of the disk is in use, as a percentage of its size and charted over the same time ranges.
On the canvas, a mounted volume is attached under its service and fills from left to right as the disk fills up. Usage is only recorded while the volume is mounted.